Horse Racing Form Guide: How to Read Form and Use It for Smarter Bets
 Available in US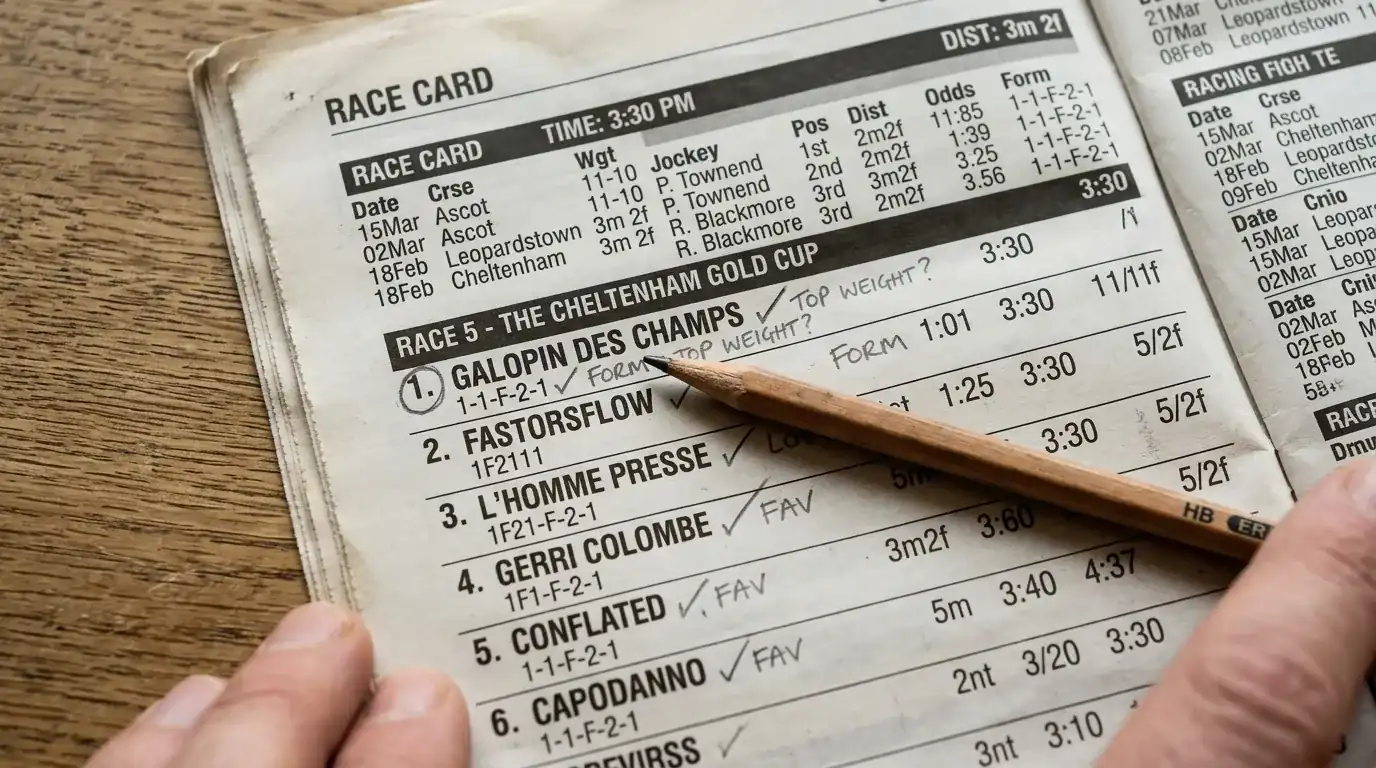
Form Is the Foundation of Every Horse Racing Bet in the UK
A punter once told me he’d been betting on horse racing for fifteen years without ever reading a form guide. He picked horses based on names, jockey silks, and “gut instinct.” He was also, by his own admission, a consistent loser. That’s not a coincidence. Form is the single most important dataset available to any horse racing bettor, and in the UK — where racecourse attendance hit 5.031 million in 2025, the first time it exceeded five million since 2019 — the sport generates more publicly available performance data per event than almost any other betting market.
Reading form isn’t complicated, but it requires a system. The numbers and letters on a racecard tell a story about every horse’s recent history: where it finished, what conditions it raced on, how it compared to today’s rivals, and whether its trajectory is upward or downward. Learning to decode that story is the first skill any serious punter needs to develop.
Decoding Form Figures: Numbers, Letters, and Symbols
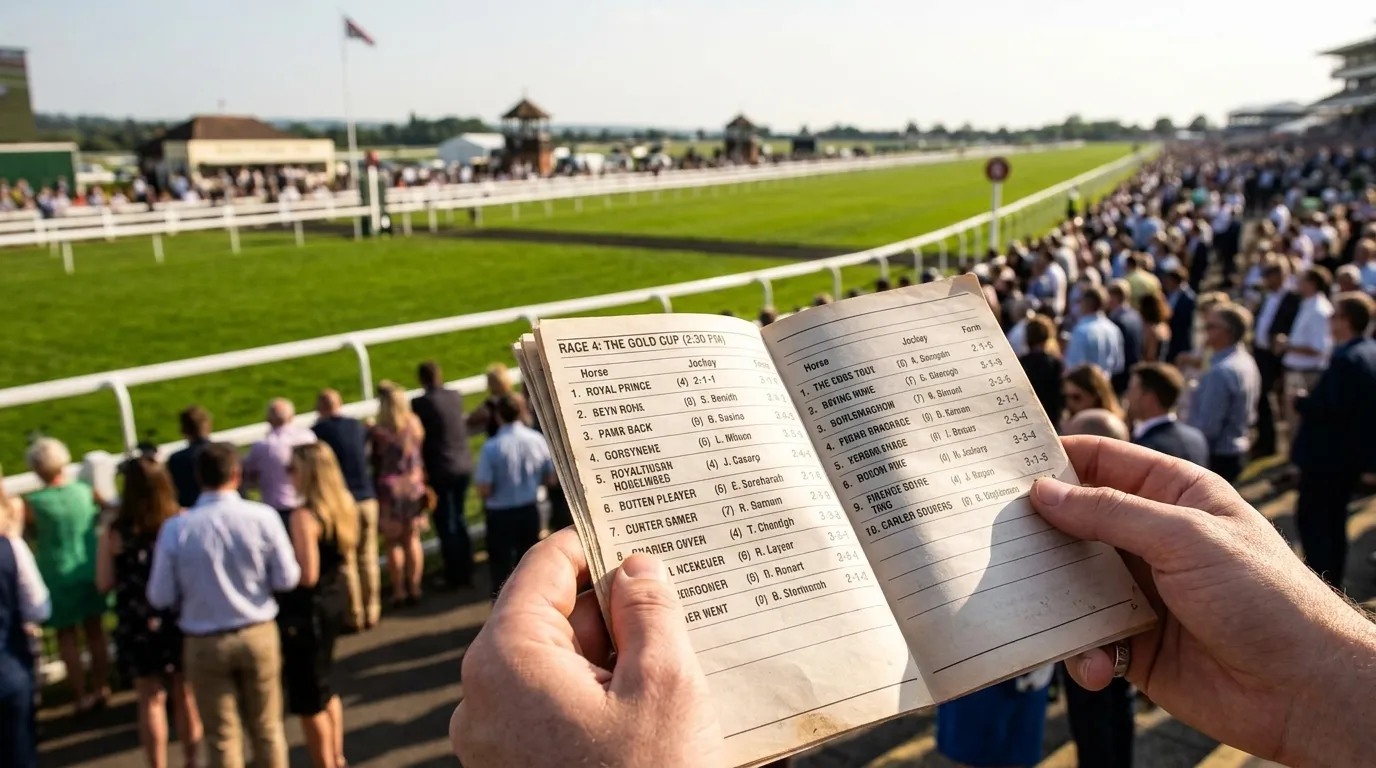
The form line is a compressed biography. It reads left to right, most recent run last. A horse showing “21312” finished second, first, third, first, and second in its last five outings — a consistent performer rarely out of the frame. A horse showing “00P70” has been largely uncompetitive, with a pulled-up run (P) buried in there as well.
Numbers 1 through 9 represent finishing positions. A “0” means the horse finished outside the first nine. Letters carry specific meanings: “F” is a fall, “U” means the jockey was unseated, “R” is a refusal, “P” is pulled up (the jockey stopped the horse during the race), “S” means slipped up, “C” is carried out (taken out of the race by another horse’s interference), and “D” means disqualified.
A dash or slash in the form line indicates a season break. “112/340” tells you the horse won twice and finished second last season, then this season has managed third, fourth, and tenth-or-worse. That break is significant — it suggests the horse has come back from a layoff in lesser form, which could reflect physical issues, an interrupted training programme, or simply a higher level of opposition this term.
Bold numbers in printed form guides indicate the horse won or placed in that run, though this convention doesn’t always carry through to digital platforms. What matters is the pattern: is the horse improving, declining, or holding form? Three consecutive runs of 1-2-1 tell a different story from 5-7-9, and the market prices those stories accordingly — though not always correctly, which is where your edge lives.
Class, Going, Distance, and Course: The Four Form Pillars
Raw form figures are a starting point, not an answer. A horse that finished first last time out sounds appealing until you discover that win came in a Class 6 selling race and today it’s running in a Class 3 handicap. Context transforms the data.
Class is the hierarchy of competition. UK racing runs from Class 1 (the highest, including Group and Grade races) down to Class 7 (the lowest). A horse winning at Class 5 and then being entered at Class 3 faces significantly tougher opposition. Conversely, a horse dropping from Class 2 to Class 4 is the one to watch — it may have been outclassed at the higher level but possesses more ability than its form figures suggest at today’s grade.
Going preference divides horses into ground specialists. Some thrive on firm ground, others need soft or heavy conditions to show their best. Favourites win around 34% of all UK races, but that average masks enormous variance based on going suitability. A favourite running on ground it hates is far less reliable than its price implies. Always cross-reference a horse’s previous runs on similar ground to today’s official going description.
Distance suitability is equally critical. A horse with stamina to stay three miles might struggle over two. A speed-reliant miler entered for a mile and a half might burn out in the final two furlongs. The form guide shows the distance of every previous race, and pattern recognition here is straightforward — does the horse finish its races strongly, or does it fade?
Course form adds another layer. Some UK tracks — Cheltenham’s uphill finish, Epsom’s camber, Chester’s tight turns — exaggerate certain traits. A horse with previous wins at today’s course has demonstrated it handles the specific demands of that layout. Course winners carry an edge that the market frequently underprices.
Using Form Data for In-Play Horse Racing Decisions
Form analysis doesn’t stop when the race starts. In-play betting gives you a live look at whether the form story is playing out as expected, and the punters who profit from in-play markets are almost always the ones who’ve done the pre-race form work.
Here’s a practical example. You’ve identified a horse with strong course form and a preference for being held up in rear before finishing strongly. The race starts, and your selection is last of eight turning into the home straight. A punter who hasn’t read the form sees a horse losing badly and dismisses it. You see a horse running its race exactly as its form predicts — and the in-play price has drifted because the market is reacting to the visual, not the data.
Pace analysis from previous form is particularly useful in-play. If you know a front-runner has a record of fading in the final furlong, watching it lead with two furlongs to go doesn’t change that pattern. The in-play odds might have shortened dramatically on the leader, but the form tells you the late challenge is coming. Trading against the leader at a compressed price, while backing a proven closer at a drifted price, is a classic form-informed in-play play.
The form guide is free, comprehensive, and available for every race run in Britain. Not using it is equivalent to playing poker without looking at your cards. The information is there — the only question is whether you take the time to read it. For a deeper understanding of how UK odds are formed and what they tell you about how the market interprets form, that connection between data and price is where the real analysis begins.
Form Guide Questions Answered
How many past races should I analyse when reading horse racing form?
A minimum of five recent runs gives you a useful sample, though six to ten runs is better for identifying consistent patterns. For horses returning from a layoff with only one or two recent runs, look at the pre-break form as well but discount it slightly — fitness and circumstances may have changed. For novices with only two or three career starts, each run carries more weight individually.
Does course form or going preference matter more for UK Flat racing?
Going preference generally has a greater impact on Flat racing outcomes because Flat horses are more specialised by surface than jumpers. A horse bred for fast ground running on soft can lose several lengths compared to its ability, whereas course form matters more on tracks with unusual characteristics — Chester, Epsom, and Ascot all produce course specialists. When both factors conflict, going preference usually takes priority.
Published by the Live Betting Horse Racing team.